The market (and even Fed forecasters) is almost always wrong about interest rates:
Interest rates are dominating the conversation, filling daily news briefings and leaving investors nervously waiting for the next move.
The graph covers the period from 2008 and depicts the Fed funds rate and their futures curves at different points in time. Market participants are more wrong than correct regarding the future shifts of the Fed funds rate, as you can see below.
Markets are constantly full of unknowns and predicting their future path is extremely hard:
- When the market was expecting future rates to go up, the Fed kept cutting rates.
- In recent years, the market had anticipated a brief cycle of interest rate hikes and cuts by the Fed, but their expectations turned out to be incorrect.
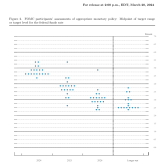
The Fed also publishes an interest rate dot plot chart, where a dot reflects what each Fed banker thinks of the Fed funds rate at the end of each calendar year:
- The Fed’s and the market’s forecasts about the future interest rates are similar, and always wrong.
- The Fed dot plot chart helps to anchor the market expectations of future Fed fund rate path.
- “The direction of the forecasting mistake is always identical, suggesting that the market is taking its cue about the future path of interest rates from the Fed’s dot plot” argues Torsten Slok, Apollo Chief Economist.
Will the market be wrong (again) about the first Fed interest rate cut in 2024?
Source: Apollo // #investing #markets #interestRates
Leave a Reply