𝐕𝐞𝐧𝐭𝐞𝐫𝐞 𝐂𝐚𝐩𝐢𝐭𝐚𝐥: 𝐎𝐧𝐥𝐲 𝐜𝐩𝐩𝐞𝐫 𝐐𝐞𝐚𝐫𝐭𝐢𝐥𝐞 𝐃𝐞𝐧𝐝𝐬 𝐇𝐚𝐨𝐞 𝐑𝐞𝐭𝐞𝐫𝐧𝐞𝐝 >2𝐗 𝐃𝐨𝐫 𝐈𝐧𝐨𝐨𝐬𝐭𝐨𝐫𝐬
The most recent UK Venture Capital Financial Returns report provides a comprehensive performance analysis of VC funds. The report mainly focuses on the UK’s VC ecosystem, while also covering Europe and the US. Authors have amassed a large amount of data from commercial data providers (Pitchbook, Preqin), fund managers, and their alternative investments.
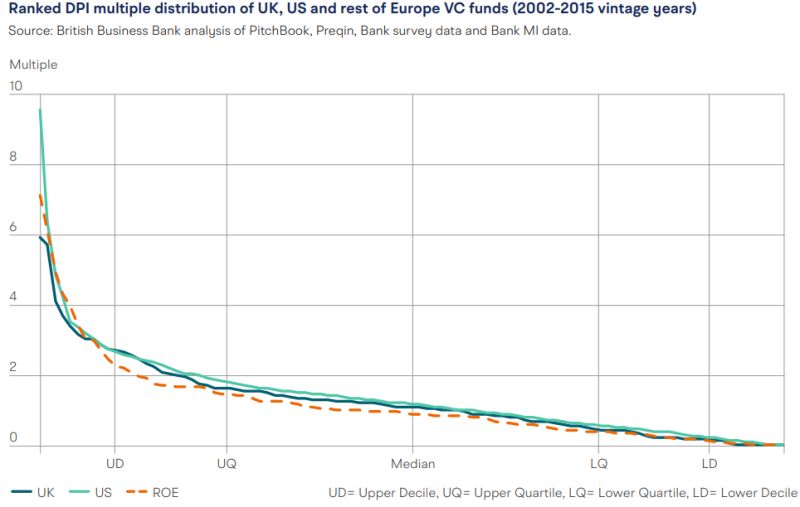
One key metric is distributions to investors relative to their invested capital, or DPI. It shows the multiple of invested capital already distributed to funds’ investors. The data covers vintages (2002-2015) that had sufficient time to reach maturity and realize investments (VC funds usually have a lifetime of 10-12 years).
Insights from the DPI distribution graph:
🔹Power law distribution of DPI multiples
🔹Distribution of DPIs is similar for all analyzed regions: US, UK, and Europe (lags below top decile).
🔹Median return is clustered around 1x.
🔹Upper quartile (top 25% of all VC funds) has returned less than 2x of invested capital (or around 9.5% p.a.)
🔹Upper decile (top 10%) has less than 3x DPI ratio (or around 15.5% p.a.)
Of course, DPI does not show everything and there might be some remaining portfolio companies to be realized that could bring the total return higher.
Even so, playing against the house or power law is complicated. Investors must either get access to top managers, try selecting the next best emerging managers, or go for an asset class with a more promising return distribution.
Source: British Business Bank // #AssetAllocation #VentureCapital
Leave a Reply