A complex graph with abundant data presented by KKR Insights provides information on the relative valuation of assets over a period of 20 years.
The values of various assets have declined across major categories since the markets reached their peak 18 months ago. Certain assets seem to have appealing 20Y relative valuation:
- US Small-cap valuation near an all-time low, though even in Dec ’21 index P/E ratio was below the 20Y average.
- US Mid-cap valuation almost halved (90% percentile > 47%, to reach 20Y average).
- US Large-cap shows resilience, with Big 5 leading the way.
- Public REITs got hammered due to rising interest rates and recession fears (87% > 10%).
- Private equity buyout (100% > 80%) valuation partially followed public comps, with the highest uncertainty and discounts on the secondary market at around Q1 ’23.
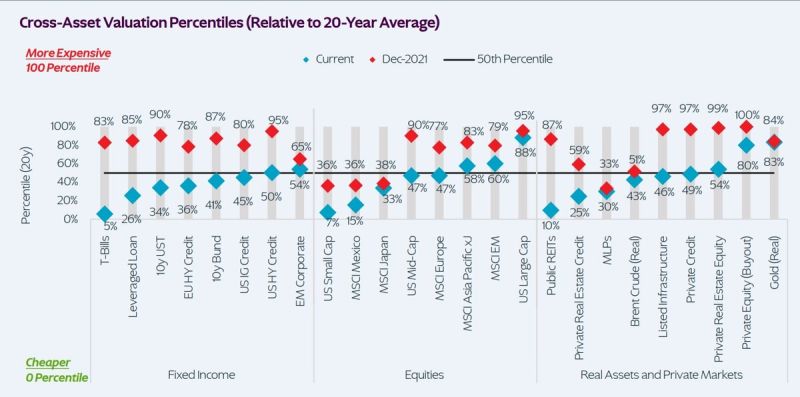
Source: KKR Insights / #markets #investment #privateequity
Leave a Reply